
Princess Anne Park

Flooding in Princess Anne Park

Flooding in Princess Anne Park
Princess Anne Park
Princess Anne Park
Princess Anne Park is the location our team has decided would be the ideal place to implement BMPs, specifically bioretention.
By adding bioretention cells to the park, we hope to reduce the amount of flooding of the sports fields and the main entrance of the park. The photos to the left show the extent of the flooding that currently occurs during a rain event.
Design Objectives
The following are the main objectives our team kept in mind while designing the BMPs for the Park.
-
Brings aesthetic appeal to the Princess Anne Park
-
Has educational value
-
Decreasing the flooding issues throughout the park
-
Improves water quality of the stormwater being captured and treated
-
Simple upkeep and minimal maintenance
Drainage Area Delineation
Princess Anne Park
One of the first steps we took in the design process was delineating the area the drains to the park. This is an important step because this area is used to estimate the amount of runoff our design will have to accommodate, determine the land cover percentages needed for sizing calculations, and the best locations for the bioretention cells within the park.
Below you will find a series of maps created during the delineation process as well as the final drainage areas.

This first map displays one of the first steps of the delineation process when using GIS. The flow direction data is raster data obtained from the LIDAR data provided to out team by the City of Norfolk. This flow direction data is necessary for the second step of the process, determining to highest points of flow accumulation.

This map shows the flow accumulation paths for the areas surrounding Princess Anne Park. The accumulation data was obtained from the flow direction data shown above. based on the flow direct raster, the flow accumulation function is able to determine where the paths with the most water accumulation. Using the points of accumulation shown by the red/orange wavy lines, a pour point for our drainage area was picked. The pour point is indicated by the red dot on the map.

This map shows the drainage area that was delineated using the flow data and point point chosen.

The area in the map shown above was determined to be the final drainage area that will contribute most of the data used in the sizing calculations.

Because of how large the drainage area is, we decided to break it up into two separate areas. Drainage Area 1 which is the top section represented by the light blue polygon and Drainage Area 2 which is the bottom section represented by the yellow section.

Now that the drainage areas have been defined, we have to determine the percentages of land cover over these two areas. In the map above, Drainage Area 1 consists of the following land covers: low vegetation, tree canopy, tree canopy over impervious roads, tree canopy over impervious surfaces, impervious roads, and impervious surfaces. Impervious surfaces include things like roofs of houses and other surfaces that interferes with the infiltration of rainwater that are not roads.

In the map above, Drainage Area 2 consists of the following land covers: low vegetation, tree canopy, tree canopy over impervious surfaces, and impervious surfaces.
Bioretention Sizing Calculations
The following figures are of the excel sheets that were used to conduct the sizing calculations for the bioretention designs. Our team used the Runoff Reduction method to approximate the runoff volume that would have to be accounted for using 2-year, 5-year, and 10-year design storms. After running the calculations for both the top and bottom drainage areas, the surface areas predicted for the bioretention cells were determined. These values can be found in Table #1 below.

Table 1. Comparison of sizing estimations for the Top and Bottom Drainage Areas
After comparing the estimated surface area values for both the top and bottom drainage areas for the design storms, we proposed surface areas for the bioretention cells. The proposed surface areas were determined based on the estimates as well as the average sizing of typical bioretention practices. These values can be found in Table #2 below.

Table 2. Proposed Surface Areas for the Top and Bottom Drainage Areas
Cell 1, which is catching flow from the top drainage area was proposed to be 1266 square feet. Cell 2, which is catching flow from the bottom drainage area was proposed to be 650 square feet. The biggest issue with these proposed surface areas was that neither met the required storage volume necessary to handle any of the design storms that were used in the calculations. The team proposed these smaller sizes in order to keep the project reasonably priced, however the sizing estimates seemed unusually large for a project of this size. After further discussion with our partners and advisors, we discovered that the top drainage area, which is mostly impervious surface, does not need to be accounted for. All the runoff that the top drainage would contribute to the park is captured by storm drains and directed into the storm drain system. This information lead us to redefine our overall drainage area into the park and rerun our sizing calculations with the new data. Table 3 shows the old sizing estimates compared to the new estimates.

Table 3. Comparison of sizing estimations based on the old drainage areas and the newly defined drainage area
The sizing estimates for the new drainage area ended up being much more realistic than the initial sizing estimates. The runoff coefficients used were adjusted to more accurately represent the land cover of the drainage area and the majority of the impervious surface was removed from the equation. The final proposed surface area for the bioretention cell is 1430 square feet which meets the necessary storage requirements for the 2-YR, 24-hr design storm. This is shown below in Table 4.

Table 4. Proposed surface area based onsizing estimates based on the new drainage area
Calculations

Sizing Calculations using the Top Drainage Area and 2-YR, 24-hr Design Storm

Sizing Calculations using the Top Drainage Area and 5-YR, 24-hr Design Storm
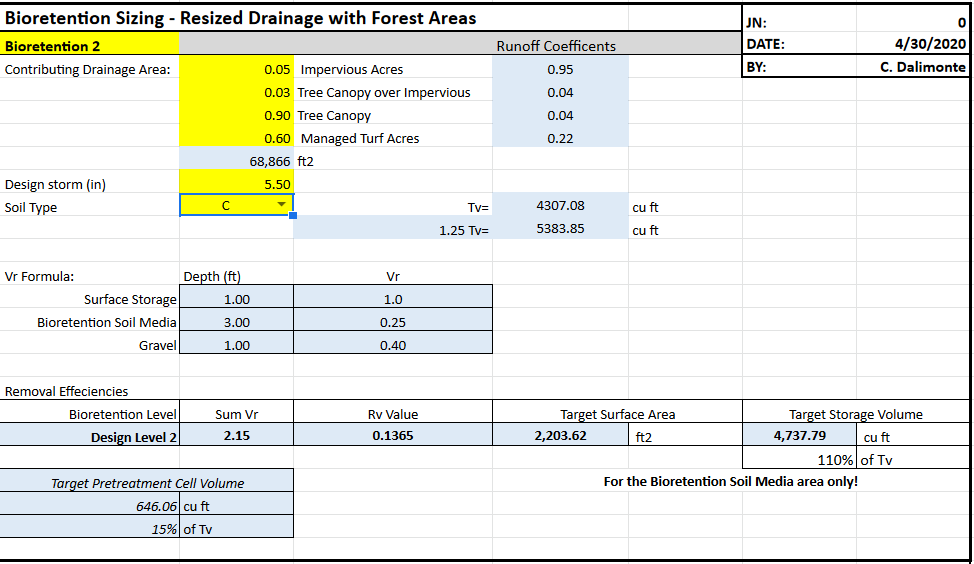
Sizing Calculations using the New Drainage Area and 10-YR, 24-hr Design Storm
Sizing Calculations using the Top Drainage Area and 2-YR, 24-hr Design Storm
CAD Drawings of Design

Figure 1. Final Site Drawing

Figure 2. Final Bioretention Cell Design and Specifications
Final Drainage Area for Princess Anne Park

Bioretention Maintenance Plan
Because our design is composed of biological species as well as interacting with stormwater runoff, maintenance and upkeep is key to ensuring the BMP functions properly and effectively. The maintenance plan created can be accessed by clicking on the link below.
Cost Analysis
Along with the maintenance plan, we also put together a cost analysis for the implementation of the bioretention cell. The cost analysis can be accessed using the link below.